
Who we help
We partner with growing organisations that want to turn data into a real business advantage.
Growing Businesses
Scaling companies that need clearer visibility of performance to make confident decisions and sustain growth.
Data-Driven SMEs
Teams already working with data who want better reporting, automation and a single source of truth they can rely on.
Businesses Exploring AI
Organisations curious about AI but unsure where to start — we help you adopt it practically, safely and with real ROI.
Leadership Teams
Owners and executives who need the right metrics and insights in front of them to steer the business with confidence.
OUR APPROACH
From scattered data to business growth
We take you through a clear, proven journey — turning the data you already have into smarter decisions and measurable growth.
WHAT YOU GET
Dashboards built around your decisions
Clear, real-time views of the metrics that matter — explore the kind of dashboards we build for each part of your business.
Revenue (YTD)
R 2.4M
▲ 12.5%
Gross Margin
38.2%
▲ 3.1%
Active Customers
1,284
▲ 8.4%
Avg Order Value
R 1,870
▼ 2.1%
Revenue — last 10 months
Revenue by segment
Pipeline Value
R 5.8M
▲ 18%
Win Rate
32%
▲ 4%
Deals Closed
47
▲ 11
Avg Deal Size
R 124K
▲ 6%
Sales — last 10 months
Sales by channel
Total Customers
1,284
▲ 8%
New This Month
86
▲ 14%
Churn Rate
4.2%
▼ 0.8%
NPS Score
64
▲ 6
Customer growth — last 10 months
Customers by segment
On-Time Delivery
94%
▲ 2%
Avg Turnaround
2.3d
▼ 0.4d
Utilisation
78%
▲ 5%
Open Jobs
23
▼ 7
Jobs completed — last 10 months
Job status
Cash Position
R 3.1M
▲ 9%
Net Profit Margin
22%
▲ 3%
Debtor Days
34
▼ 6
Monthly Expenses
R 890K
▼ 4%
Cash flow — last 10 months
Expense breakdown
WHY IALYTICS
Why growing businesses choose Ialytics
Senior expertise, practical solutions and a genuinely SME-focused approach — delivered locally.
Senior Consultant Expertise
You work directly with experienced senior consultants — not junior staff learning on your project.
Practical AI Implementation
We focus on AI that solves real problems and delivers measurable ROI — not hype.
SME-Focused Approach
Solutions sized and priced for growing businesses, not enterprise budgets.
Technology Agnostic
We recommend the right tools for your needs and budget — never whatever we’re tied to.
Local South African Support
Cape Town-based, in your timezone and fluent in the local business landscape.
20+
Years of Experience
Proven
Analytics & AI Delivery
Multi
Industry Expertise
Local
Cape Town-Based Support
MEET YOUR CONSULTANT
You’ll work with me — not a junior team
I’m Rupert van Zyl. I founded ialytics after more than twenty years building data platforms, BI and AI for South African organisations. I still do the work myself: the person on your strategy call is the person who designs the model, builds the dashboard and stays on the line when a number looks wrong.
I’m based in Durbanville. I work South African hours. I pick tools that fit your team (Power BI, Looker Studio, Xero, Sage, HubSpot, Shopify) rather than whatever a vendor is pushing this quarter.
More about the way I work →WORK, NOT THEORY
Two problems I keep seeing. Two ways they get solved.
One picture of the business
The exec team could not see the business in one place. Project mail, contracts in the document system, the accounting pack, and the project tool each told a different story. Problems landed late, usually as a surprise.
I built a warehouse and decision-support layer over those four sources, so delivery, money and obligations sit in a single view. An AI layer on top summarises what changed, flags likely issues early, and reads contractual obligations against the actual email on each project.
They monitor the work as it happens, instead of reconciling four exports after the fact.
Invoices that capture themselves
Month-end meant sitting with a pile of invoices and typing them into Excel. It took days. It also put every figure one keystroke away from being wrong.
I built a scan that reads the invoices and writes them straight into their Excel workspace. Same pack they already used. No re-keying.
Days of capture work came off the month, and the typing errors went with them.
Blog
Insights & analysis
-
Stop Building the Monthly Pack in Excel: Automated Xero and Sage Reporting for SA SMEs
Read more →: Stop Building the Monthly Pack in Excel: Automated Xero and Sage Reporting for SA SMEsHow South African SMEs can stop rebuilding the Xero or Sage pack in Excel every month, and what a sensible automated reporting setup actually…
-
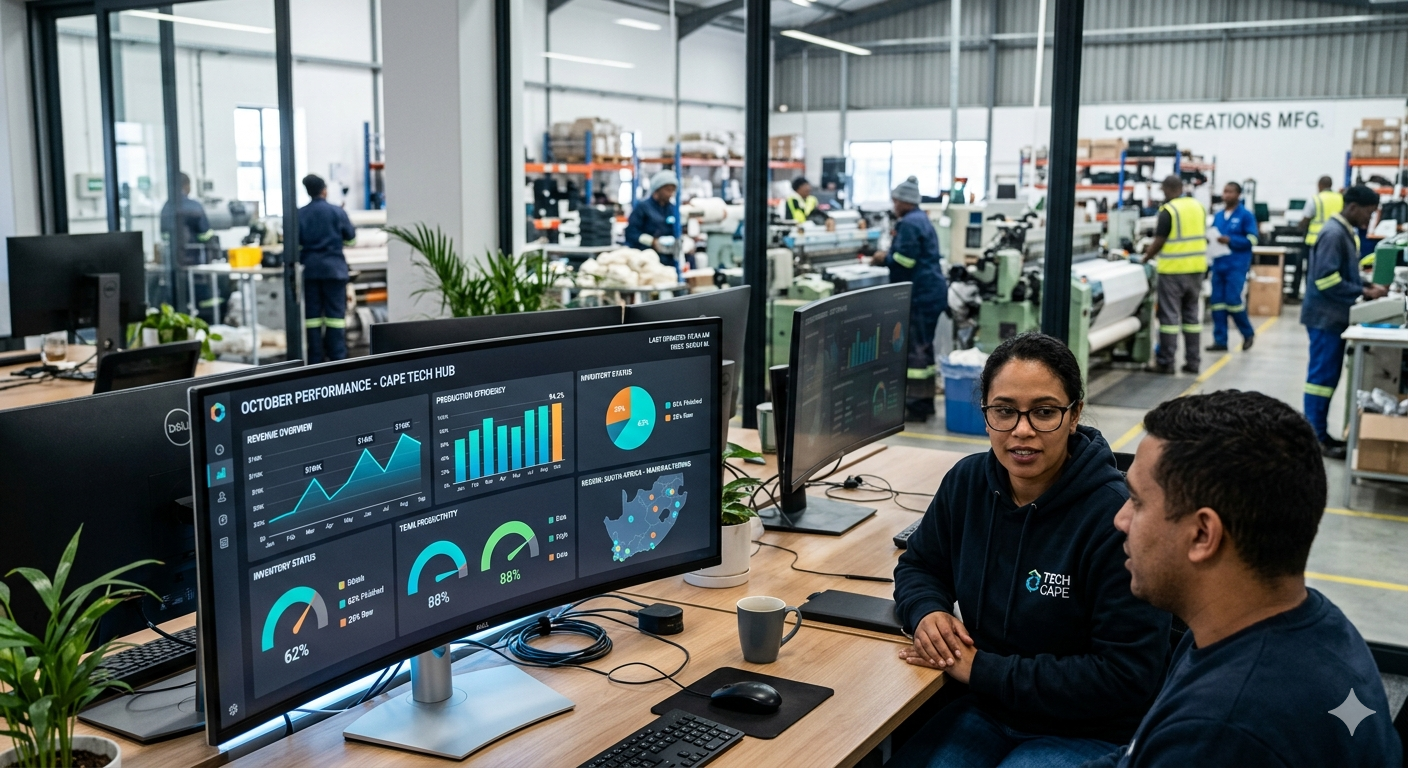
AI Is Getting Smarter. Is Your Data Keeping Up?
Read more →: AI Is Getting Smarter. Is Your Data Keeping Up?But there’s a problem.Many AI projects struggle to move beyond impressive demonstrations because the data underneath isn’t ready.The reality inside many organisations is familiar:…
-

AI Isn’t Just for Big Corporates Anymore: What’s Changed for SMEs
Read more →: AI Isn’t Just for Big Corporates Anymore: What’s Changed for SMEsFor years, AI felt like something reserved for large enterprises with deep pockets. That has changed. Here is what shifted and why smaller businesses…
-

5 Ways a Small Business Can Use AI to Outcompete Larger Rivals
Read more →: 5 Ways a Small Business Can Use AI to Outcompete Larger RivalsBeing small can be an advantage. Here are five practical ways smaller businesses can use AI to move faster and compete with bigger players.
-

What AI Can (and Can’t) Do for Your Small Business Right Now
Read more →: What AI Can (and Can’t) Do for Your Small Business Right NowAI is genuinely useful, but the hype can set unrealistic expectations. Here is a grounded look at what AI can and cannot do for…
-
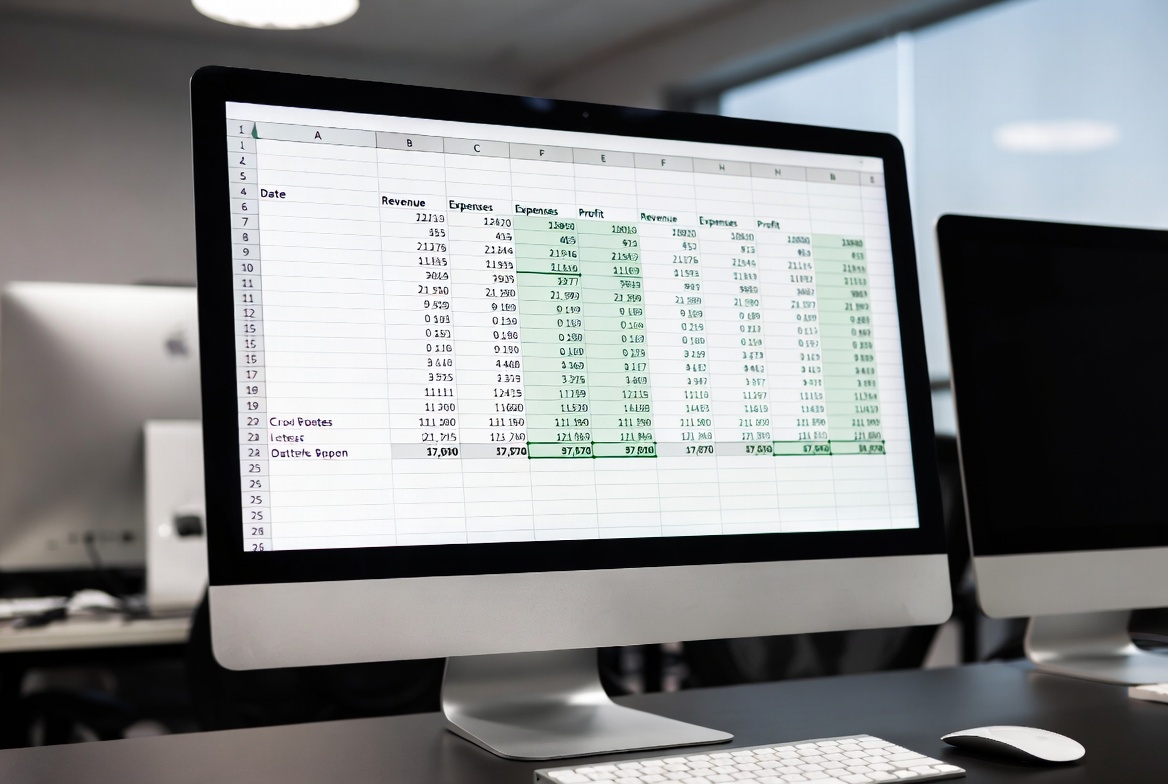
From Spreadsheets to Smart Insights: A Practical First Step into AI for SMEs
Read more →: From Spreadsheets to Smart Insights: A Practical First Step into AI for SMEsMost small businesses already sit on a goldmine of data in their spreadsheets. Here is a low-risk way to take a first step from…